Kronometrix provides access to different user-interface components, called data widgets, which can display data coming from one or many data sources. Data widgets are individual UI components, like a chart or indicator which can be accessed using a unique ID (“Widget ID”) and easy to add to 3rd parties portals using IFRAME capability. This way anyone can add and embed Kronometrix UI components to various portals and receive automatically data.
Such way data is sent in real-time from Kronometrix platform to various sites without to login or do any manual extra work. This simplifies data visualization and reporting between various sites.
Widget Types
By default Kronometrix offers support for the following data widgets: chart, indicator, gauge, availability, air quality index:
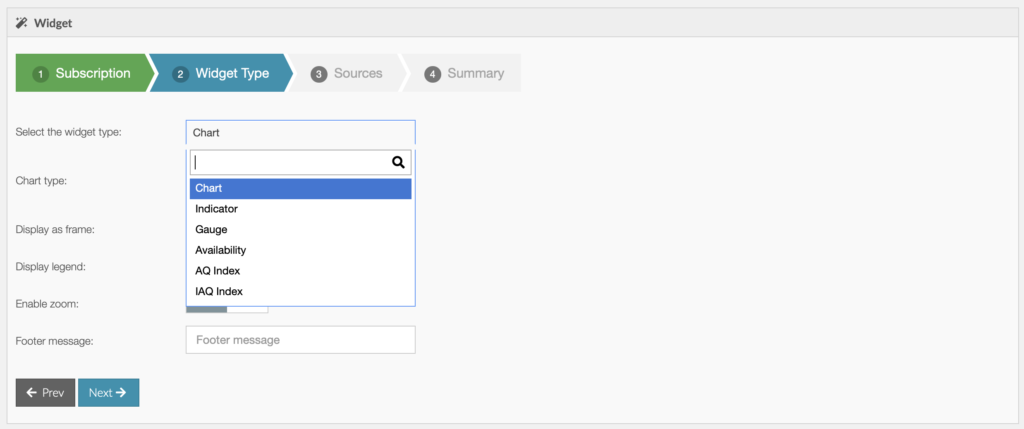
Chart Widgets
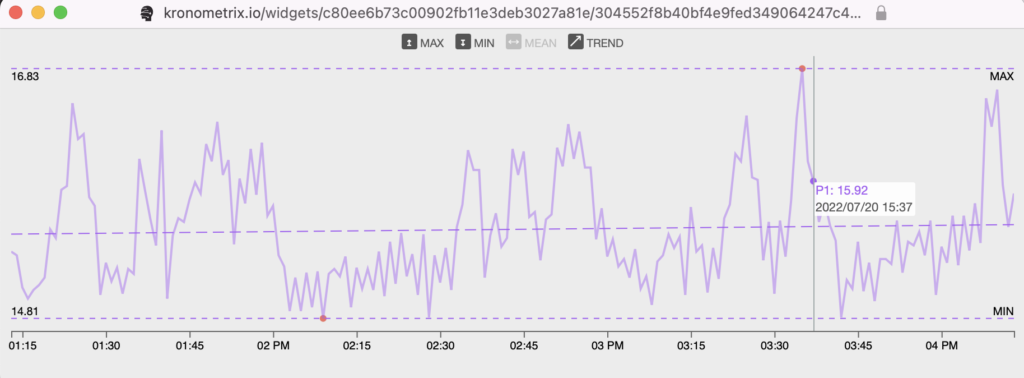
There are different type of chart data widgets: Line, Stack, Stream and Trend. the Trend chart widget is used for Environmental monitoring, like Air Quality or for ICT data.
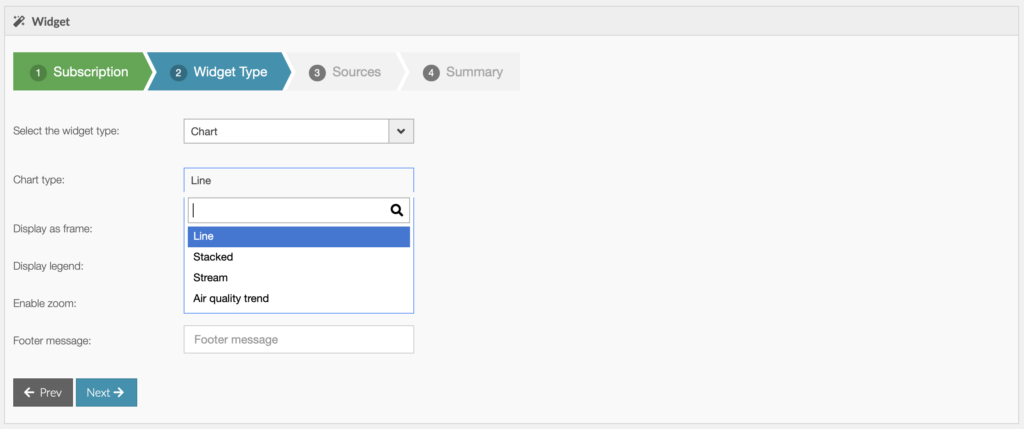
Chart Line
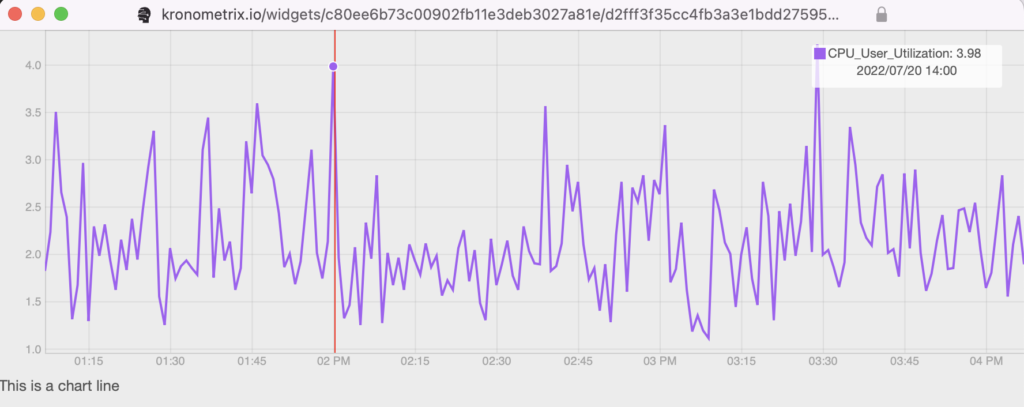
Chart Stack
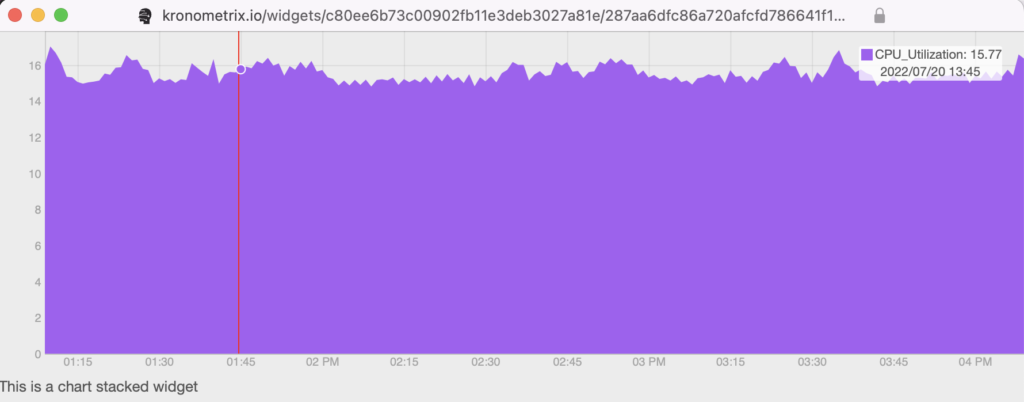
Chart Stream
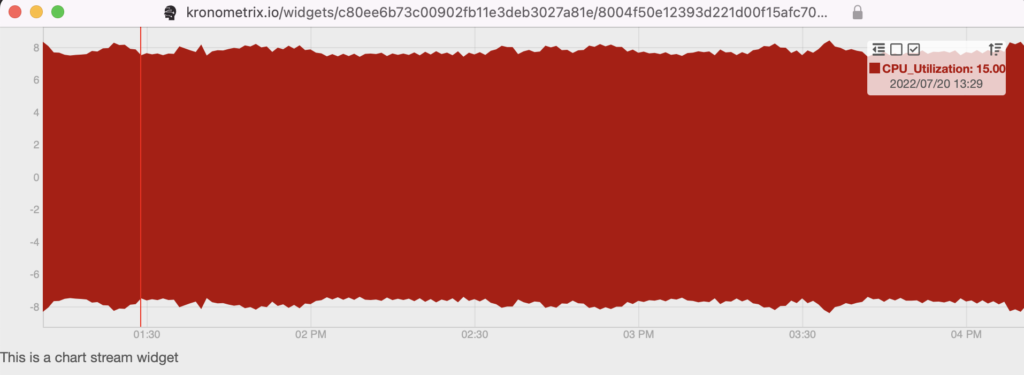
Chart Trends
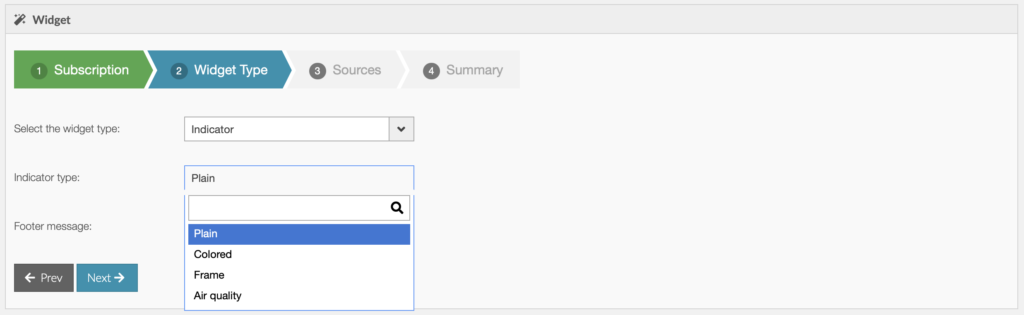
Indicator
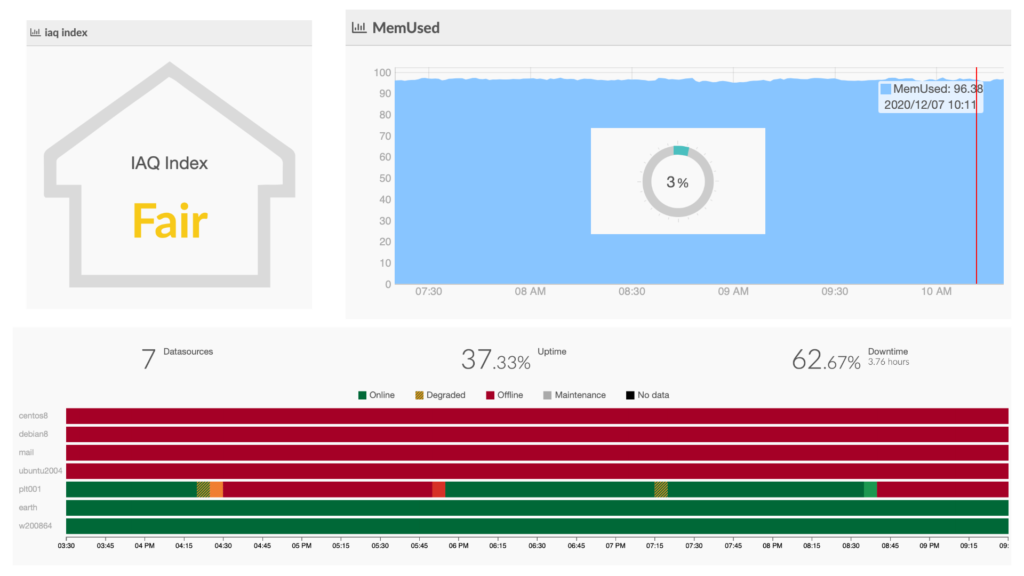
There are different types of indicators: Numeric (Plain, Coloured, Frame) and Air Quality. Numeric indicators are simple displaying any summary statistics values: LAST, MIN, MAX, SUM etc with different colour and options from a single data source. Air Quality indicator is a special data widget to display the indoor air quality conditions.
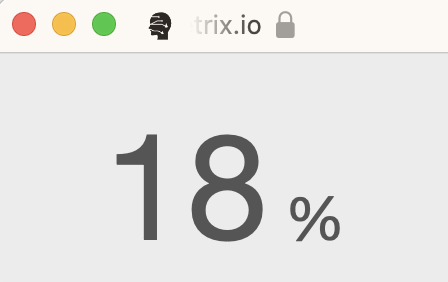
Numeric indicators
Plain Indicator
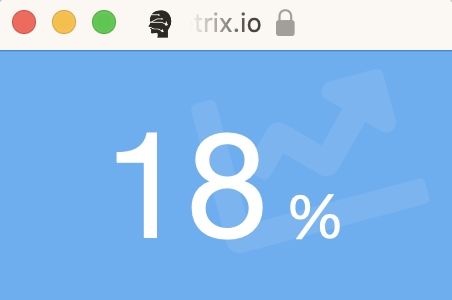
Coloured Indicator
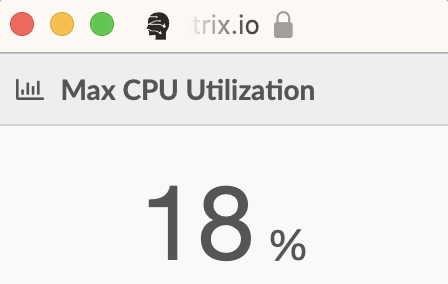
Frame Indicator
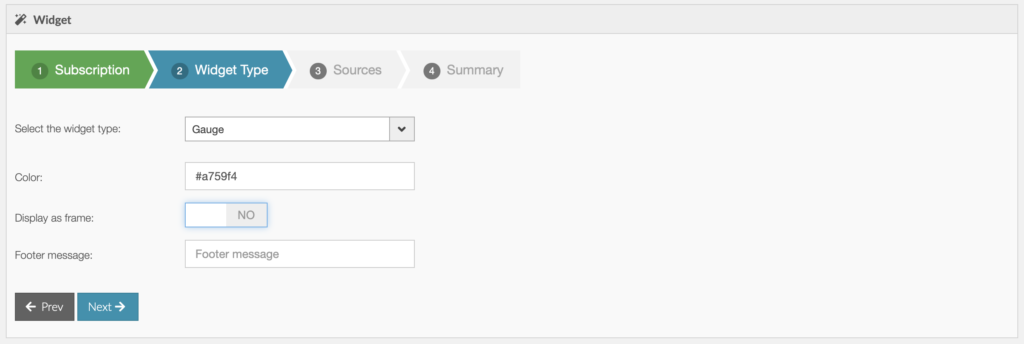
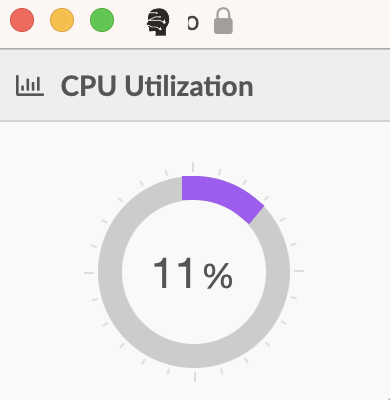
Gauge
The gauge indicator will display any numerical value, from one single data-source. The value displayed can be any summary statistics functioned defined for the specific source: MIN, LAST, MAX, SUM etc.
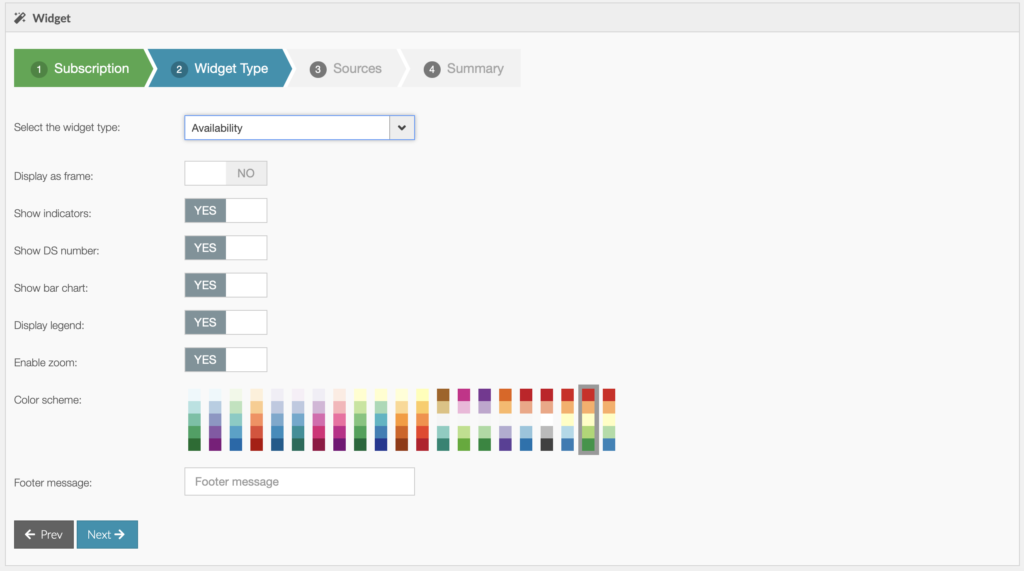
Operational Availability
City Air quality Index
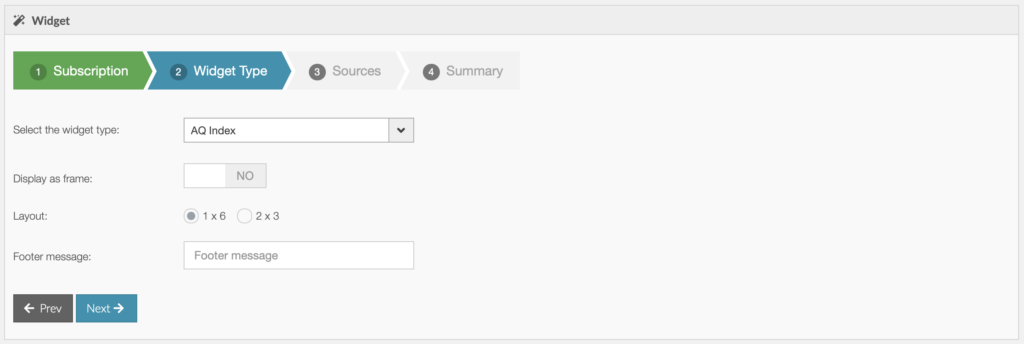
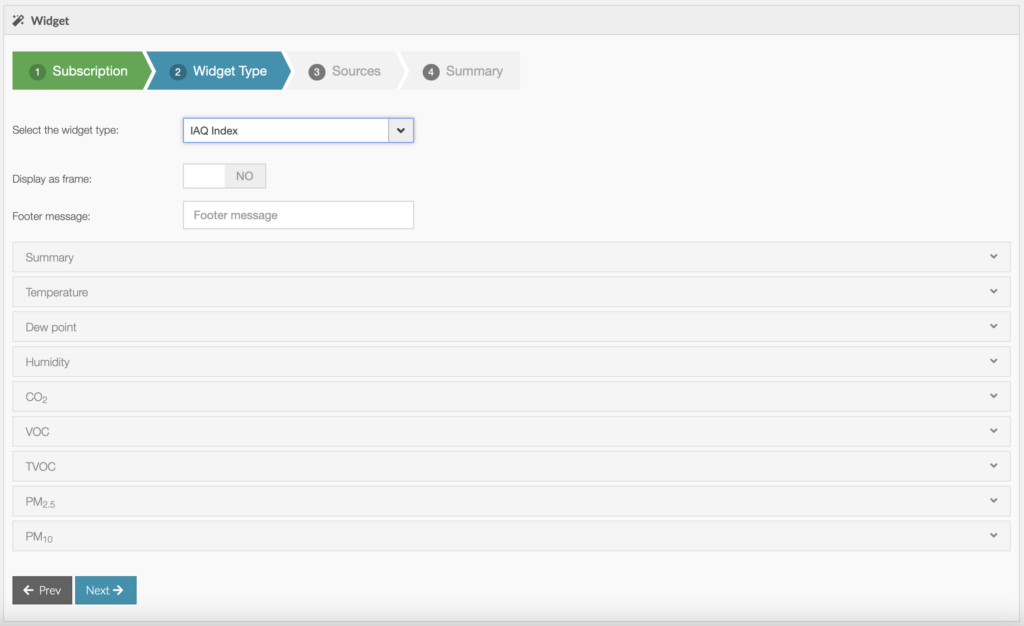
Indoor Air Quality Index