
This document describes how can you analyse and visualize your data using Kronometrix Data Analytics Platform.
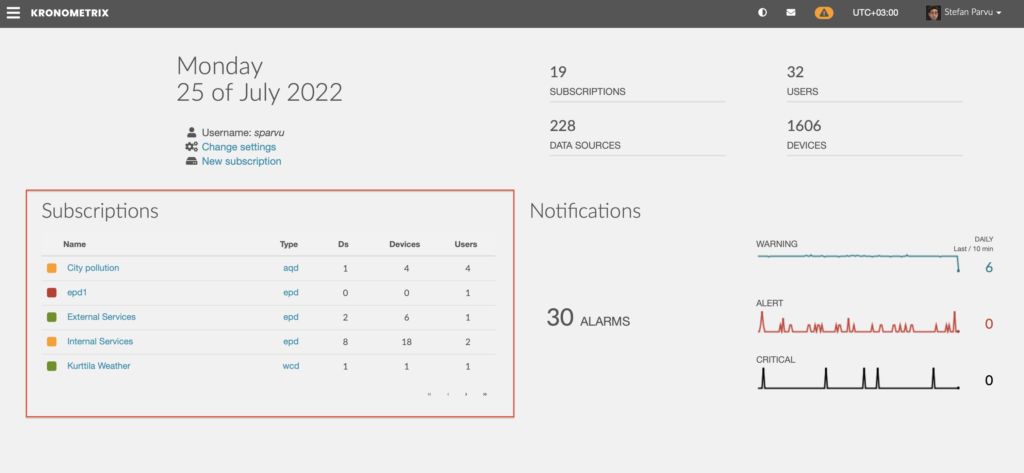
Kronometrix can easily display your data using subscriptions. Login to Kronometrix SaaS and select your subscription you are interested in. After you logged in you will have access to the main landing page. Check all your data subscriptions you have access to, from the left side of the screen.
The landing page
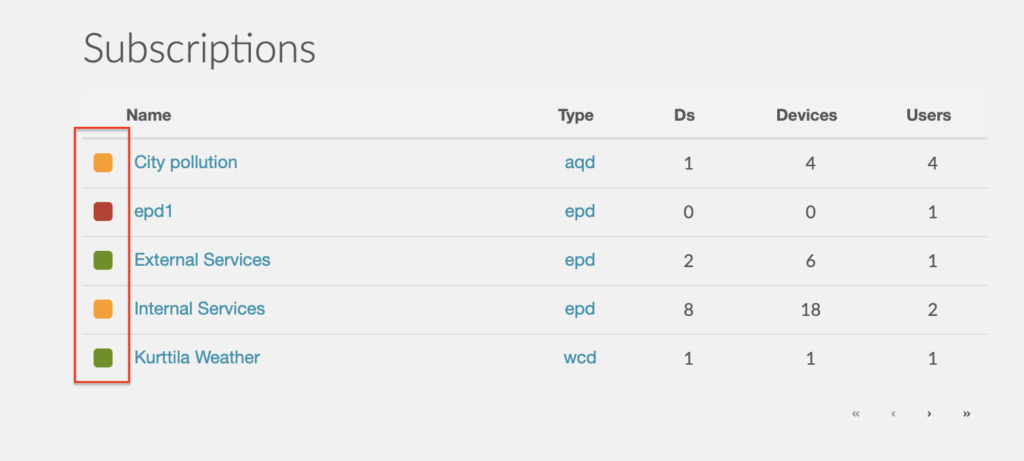
Data Feed
For each data subscription Kronometrix will report if data arrives or not from all data sources. See below:
A more detailed information is displayed when moving over the subscription data feed icon.
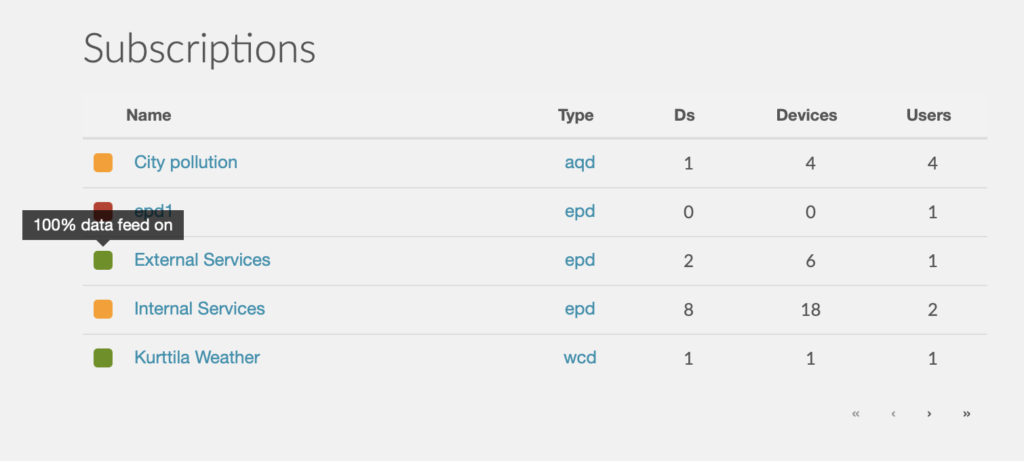
Green – data arrives from all data sources within subscription. Example: using ‘External Services’ data subscription we can easily see that we are receiving data from all sources of data.
Orange – data does not arrive from all data sources, there are some sources of data for which we are missing data from.
Red – no data arrives from any sources of data, or there are no sources of data defined within data subscription.
Type
This describes the type of data subscription. Selecting that will display all monitoring objects within subscription, the metrics and summary statistics defined for a certain subscription type.
DS
Reports the number of data sources within subscription. Learn more what is a devices or data source.
Devices
Displays the number of devices or components from all data sources within subscription. Learn more what is a devices or data source.
Users
Displays the total number of users collaborating to that subscription.
Select your subscription
Click and select your subscription. Automatically, based on the subscription type you will be directed to see your data suing Kronometrix applications. A Kronometrix application is a visual rich based application which displays a series of key performance indicators, charts and other information from one or many data sources. Learn more about Kronometrix applications.
For example, when you select a computer performance data subscription you will have access to one or many applications. This is the Executive applications within Computer Performance Data subscription:
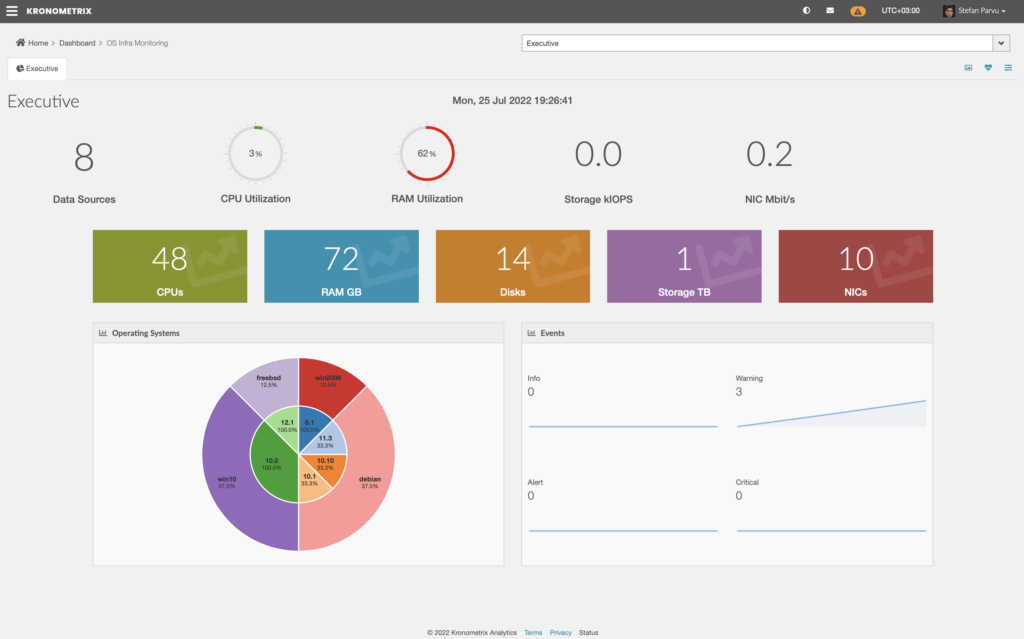
On the top level you will have the data source selector, where you can display each data source individually, groups or all sources of data.

After selecting one data source you can see the following applications:
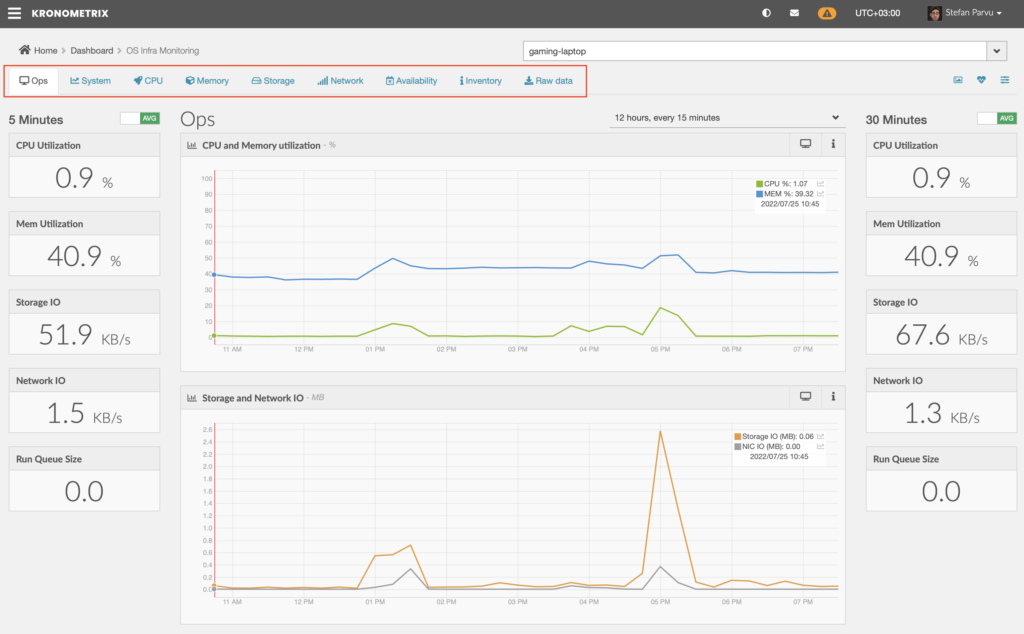
For each subscription type there are a number of applications, specific for individual sources of data, groups or all sources of data. For example for individual computer systems which can be virtual or bare-metal systems we have the following applications: Ops, System, CPU, Memory, Storage, Network, Availability, Inventory and Raw data.